Getting results means investing in kids of color, so they can overcome the barriers created by racism and poverty.
Having basic needs met—like adequate food, safe and stable housing, and health care—is fundamental to all areas of well-being. No child should go without the basics. In Washington state, tremendous progress has been made in ensuring all children have health care coverage, although rates of coverage among American Indian children lag significantly behind their peers. Too many children experience homelessness and hunger, especially children of color, limiting their ability to fully participate in school and in their communities. The limited availability of good jobs in Washington state, combined with stagnant wages and the rise in cost-of-living, will continue to pose a major threat to the well-being of children and families, especially in communities of color.
Jump down to indicator:
- Percentage of Children without Health Insurance Coverage
- Percentage of Students Who Are Homeless & Percentage of Children Who Are Food Insecure
- Ratio of Median Income to Cost-of-Living
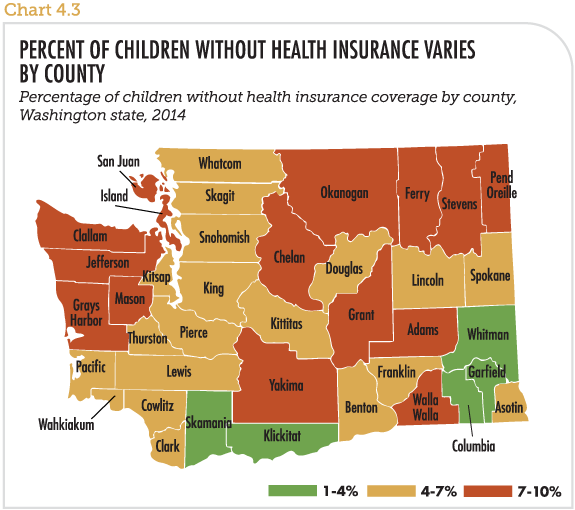
Percentage of Children without Health Insurance Coverage
Why is this indicator important?
All parents should be able to take their children to see a doctor when they are sick, and get the routine care children need for healthy development, without the fear of how much it will cost. Children who have health care coverage are more likely to be treated for illness in a timely manner, be diagnosed early if a health condition exists, and receive care that promotes lifelong physical, mental, and oral health. ((Bovbjerg, R. & J. Hadley (2007) (PDF), Urban Institute.))
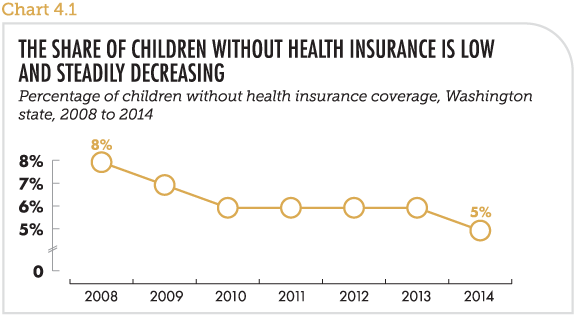
How is Washington state doing?
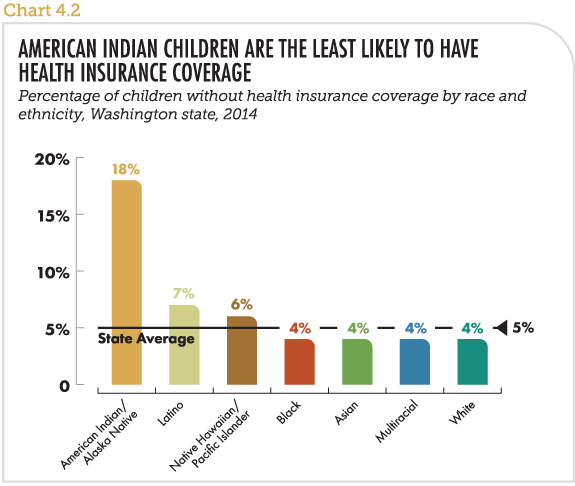
Since 2008, the number of children with health insurance increased from 92 percent to 95 percent (Chart 4.1). Coverage rates for many children of color—including Black, multiracial, and Asian children—are now on par with White children, but closing gaps in coverage for American Indian, Latino, and Pacific Islander children remains a priority (Chart 4.2).
Percentage of Students Who Are Homeless & Percentage of Children Who Are Food Insecure
Why is this indicator important?
Having a safe and stable house to sleep in each night, as well as having enough food, are fundamental to a child’s social, emotional, and physical well-being. Compared to children with adequate nutrition and stable housing, children who experience homelessness and hunger are more likely to experience trauma, chaos, trouble in school, and poorer health. The unpredictability of homelessness and hunger puts a child’s safety at risk as well, as the stress on families can reach toxic levels that may undermine relationships between parents and children. ((American Psychological Association (2016) . ))
How is Washington state doing?
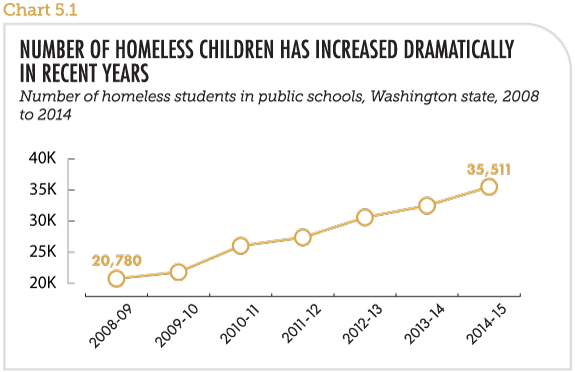
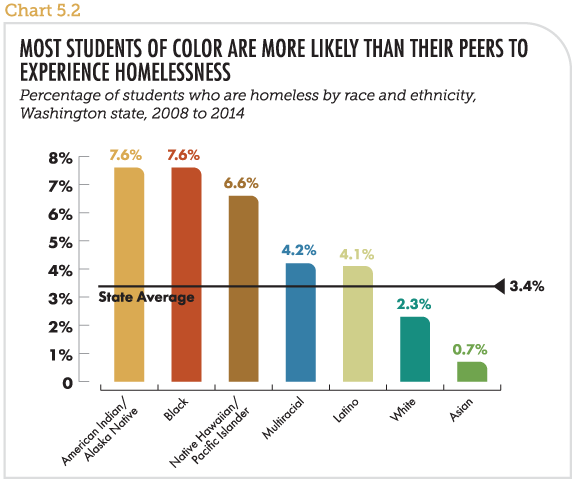
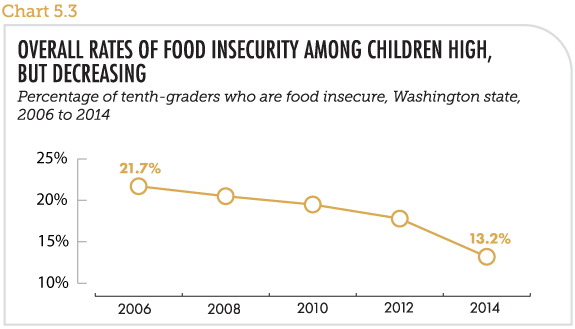
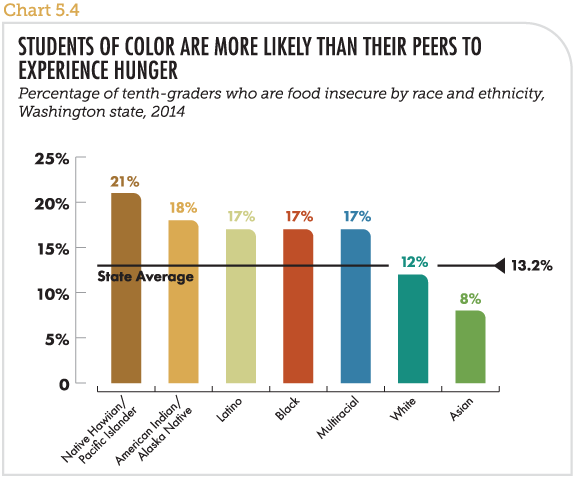
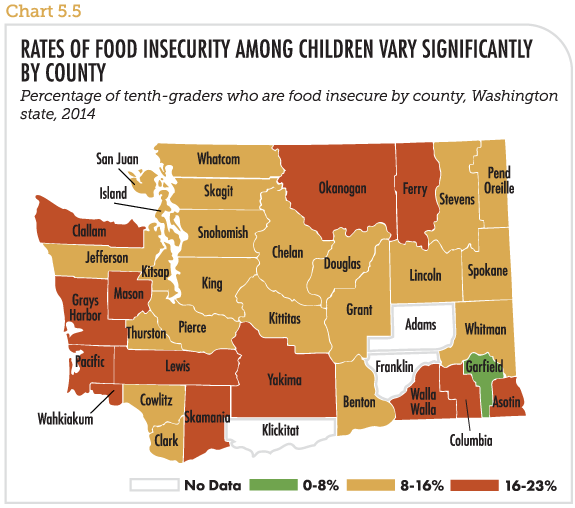
Since schools started collecting data in 2008, the number of homeless children in Washington state has increased by nearly 15,000 (Chart 5.1). Homelessness is particularly high among children of color, with rates of homelessness two to three times greater than the state average (Chart 5.2). Rates of food insecurity in Washington state—measured here as the percentage of tenth-graders reporting they had to skip meals because there was not enough money for food—is also high, but has gone down in recent years (Chart 5.3). Children of color are the most likely to experience hunger (Chart 5.4), and there is significant variation by county—Garfield County reports no food insecurity among tenth grade students, while nearly one in four in Ferry County report food insecurity (Chart 5.5).
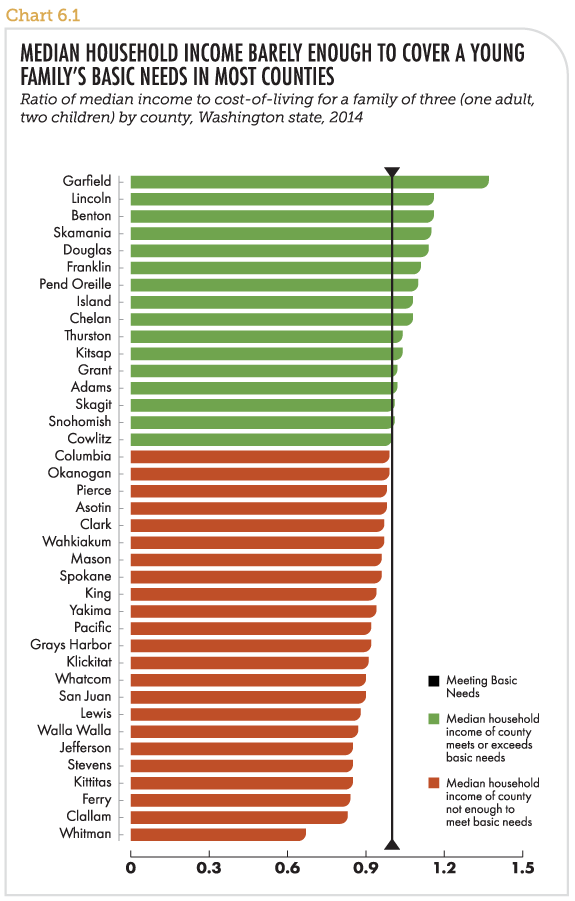
Ratio of Median Income to Cost-of-Living
Why is this indicator important?
Median household income is an important indicator of economic security in a state or region, while cost-of-living is an important indicator of how easy it is for families to meet basic needs and get ahead. When taken together, the ratio of income to cost-of-living serves as a barometer for whether an economy is working for children and families.
How is Washington state doing?
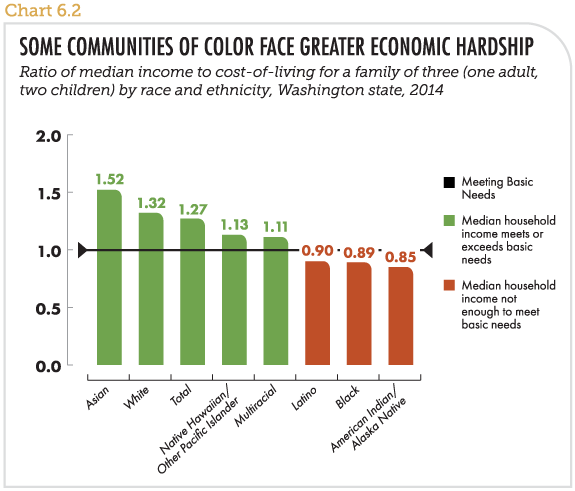
In most counties in Washington state, the median income either barely covers the or is not enough (Chart 6.1). A basic budget for a family of three (one adult, one infant, and one preschooler) includes the cost of food, housing, transportation, medical care, child care, and a small amount for miscellaneous expenses. It also includes the impact of any tax credits a family may receive, as well as 10 percent for emergency savings. These basics are affordable for half the families in Cowlitz County, for example, but beyond the means of the majority of families in Columbia County (Chart 6.1). The state economy tends to work to varying degrees for families of color, depending on race/ethnicity, with the majority of Latino, Black, and American Indian/Alaska Native families living at household incomes insufficient to meet their basic needs (Chart 6.2).